RacingNomics – NASCAR analytics blog
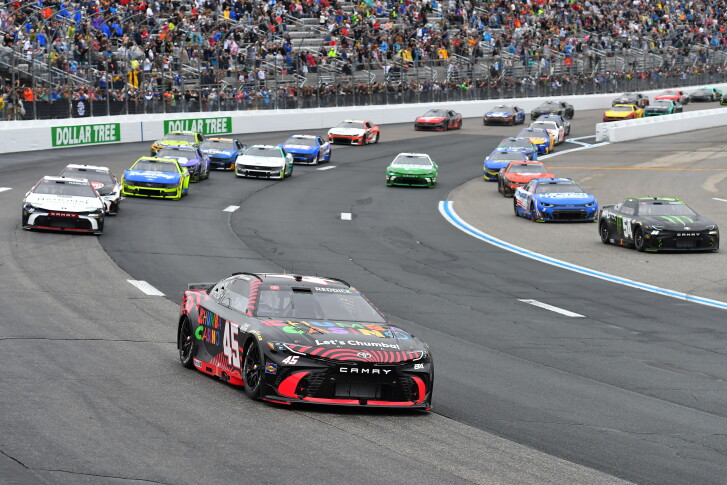
Have you ever watched a race and wondered about the hidden numbers and high-stakes economics behind every lap, every pit stop, and every championship battle? The roar of the engines is just the surface. Beneath it lies a world of complex data, multi-million dollar strategies, and business decisions that shape the sport we love. At RacingNomics, we pull back the curtain on that world. We’re here to transform how Canadian fans engage with NASCAR, moving from passive viewers to informed analysts who understand the ‘why’ behind every move on the track.
Why a NASCAR Analytics Blog is Essential for Fans
Gone are the days when fandom was just about picking a favourite driver and cheering. Modern NASCAR is a data-driven chess match at 200 mph. Understanding the analytics isn’t just for engineers; it’s the key to unlocking a deeper, more rewarding connection to the sport. It’s about seeing the patterns, predicting the strategies, and appreciating the immense financial and tactical investments that culminate in a Sunday afternoon.
From Spectator to Strategist
With the right insights, you stop just watching cars go in circles and start anticipating the next move. You’ll understand why a team might sacrifice track position for fresh tires, or how fuel-mileage calculations from Ford Performance analytics, historically leveraged by teams like Stewart-Haas Racing, can turn a 15th-place car into a winner. Analytics empower you to think like a crew chief, making every race a dynamic puzzle to solve.
The Data Driving Modern NASCAR
The sport is awash in real-time information. Teams utilize systems like SMT data (which tracks every car’s position, speed, and throttle input) and Hawk-Eye optical tracking to make split-second pit strategy calls. This data isn’t just for the teams; it’s the foundation of modern broadcasting and informed commentary. By grasping these tools, you gain access to the same layer of understanding that the professionals use.
What You’ll Find on Our NASCAR Analytics Blog
Our content is built to satisfy your curiosity for both the on-track action and the off-track machinery that makes it all possible. We break down the sport into three core pillars, providing a comprehensive look at the world of NASCAR analytics.
Race Strategy & Simulation Breakdowns
We dive deep into pivotal moments and tracks. What was the optimal tire strategy at the Phoenix Championship finale? How does the unique layout of Canadian Tire Motorsport Park in Bowmanville, Ontario, demand a different analytical approach than a 1.5-mile oval? Our race recaps are strategy sessions, explaining the critical decisions that led to victory or defeat.
Driver & Team Performance Metrics
Moving beyond wins and poles, we analyze consistency, speed in traffic, restarts, and long-run performance. We look at how drivers like Canada’s own James Hinchcliffe have utilized analytics to refine their craft, even in the IndyCar sphere, showcasing the universal language of data in motorsport. We also track team efficiencies and partnerships, such as the JRM (JR Motorsports) partnership with Canadian companies, and how such collaborations are measured for success.
The Business of Speed: NASCAR Economics
NASCAR is a multi-billion dollar industry. We explore the economics behind the glamour:
- Team budgets and the ROI on a top-tier driver.
- The massive value and activation of sponsorship deals.
- The economic impact of the NASCAR Pinty’s Series in Canada, supporting local tracks and businesses.
- The financial implications of technical regulations and the Next Gen car.
How Our NASCAR Blog Stands Out: Reviews & Approach
You might be searching for the best NASCAR analytics blog and wondering what sets one apart. Our philosophy is simple: data without insight is just noise. We don’t just report numbers; we interpret them with a distinct, engaged voice.
An Opinionated, Informed Voice
We’re fans first, analysts second. You won’t find dry, robotic statistical feeds here. Our team brings an opinionated, first-person plural perspective (“we believe,” “our analysis shows”) that sparks discussion. We take a stance on strategy calls and driver performances, inviting you to agree, disagree, and deepen your own understanding through debate.
Data You Can Actually Use
Our mission is translation. We convert complex datasets, aerodynamic simulations, and financial reports into clear, actionable insights you can use. Whether you’re in a fantasy league, a heated debate with friends, or simply want to impress with your knowledge during the next broadcast, we give you the talking points grounded in solid evidence.
Your Guide to NASCAR Analytics Content & Value
When you see keywords like NASCAR analytics blog price or buy NASCAR analytics blog, you’re likely evaluating the value of deep motorsport insight. While premium, proprietary data suites exist for industry professionals, we believe foundational knowledge should be accessible. That’s why our core blog is your free, high-quality starting point.
The Value of Deep-Dive Analysis
True analytical depth—the kind that can predict outcomes or reveal unseen advantages—has immense value. It’s what teams spend millions to acquire. We emulate that depth in our long-form articles, providing a tier of analysis that goes far beyond surface-level reporting, offering tremendous value for the dedicated fan at no cost.
Starting Your Analytics Journey Here
You don’t need to “buy” anything to begin. RacingNomics is your gateway. Bookmark our race previews, study our economic explainers, and join the comments. The value is in the knowledge you build over time, transforming your viewing experience forever. Consider this your first pit stop on a much longer, more engaging journey into the sport.
Ready to see NASCAR through a new lens? Dive into our latest race breakdown and join the conversation.
Frequently Asked Questions
Is this blog only for hardcore NASCAR fans?
Not at all! While we dive deep into analytics, we write for anyone curious about the “how” and “why” of racing. We explain concepts as we go, making advanced strategy accessible to newcomers and seasoned fans alike.
Do you cover Canadian NASCAR events and drivers?
Absolutely. As a blog serving Canadian fans, we pay special attention to events like the NASCAR Pinty’s Series, races at Canadian Tire Motorsport Park, and the involvement of Canadian drivers and sponsors in the top U.S. series, celebrating the unique Canadian footprint in the sport.
How often is new content published?
We publish regularly throughout the NASCAR season, with race previews, post-race analysis, and feature deep-dives on strategy and economics. During the off-season, we focus on driver/team reviews, economic trends, and historical analysis.
Where do you get your data and insights?
We synthesize data from official NASCAR timing and scoring, public SMT and loop data releases, team and manufacturer reports, credible industry publications, and economic studies. We then apply our own analytical frameworks to generate unique insights.
Can I request analysis on a specific topic or race?
We love hearing from our community! While we can’t guarantee every request, reader suggestions directly influence our editorial calendar. Feel free to contact us or comment on posts with your ideas.
At RacingNomics, we’re more than just a blog; we’re building a community of knowledgeable Canadian fans who appreciate the incredible complexity of NASCAR beyond the checkered flag. The data tells the real story, and we’re here to help you read it. Welcome to the hub.